Tabulation
Tables are defined on the report screen itself. As you work on the table worksheet, you fill it, one by one, with your target groups.
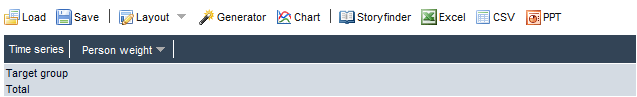
On the status bar, a range of choices are offered, depending on availability:
|
|
|
|
|
Time series: |
Opens a window for selecting the available questionnaires used for calculating time series |
|
Person weighting: |
If the selected questionnaire contains more than one weighting, you can use this drop-down menu to change the weighting for the report. |
If the questionnaire is available in multiple languages, you can change the language for the Codesheet and Layout. Program text remains shown in German. It is not necessary to configure the setting before creating a report. You can, for example, prepare your report in German and then switch over to English before outputting the results to Excel.
The right-hand window provides the working area in which the corresponding report is defined and updated in real time. Using drag-and-drop, you drag your target groups directly from the questionnaire's Codesheet to the desired position in the table: as the table base, as a target group in the pre-column or as a target group in the table head.
As soon as you drag a structure/target group to the right-hand work area, the areas in which target groups can be placed are highlighted in green.
You can insert individual codepoints, individual attributes or complete structures into the table. Multiple target groups or attributes can be inserted into the table in one operation, by selecting them beforehand.
Attributes are always added to the end of the table. After adding, however, the order of the attributes can be changed.
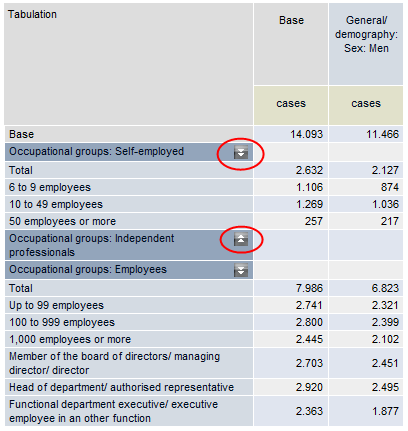
By left clicking with the mouse on an attribute header, you can hide the attribute's characteristics. This is indicated by the arrow icon next to the heading. If you click again on the heading, the characteristics are shown once more.
 Changing the order of table columns/table
rows
Changing the order of table columns/table
rows