Time series
If multiple years are available for the selected questionnaire, then you can use a time series to report on the results in the Tabulation.
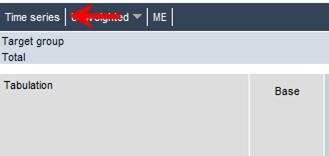
If time series counts are possible, this information is shown in the header: Time series.
First, create a report, and then click the Time series menu item.
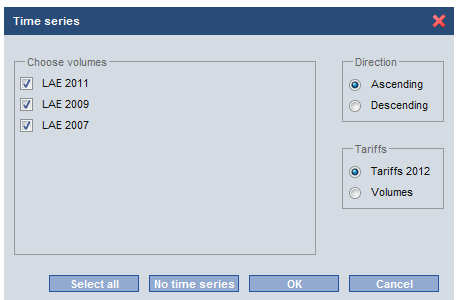
In the selection window, choose the years you require and confirm with [OK].
To calculate price-related characteristics in the time series (e.g. EUR per 1,000 users), you may either use the current tariff file or the tariff file that is valid for the respective questionnaire year.
The selections you make are documented in the table head.
To edit the body of the table, it is first necessary to access the original table, make the changes there, and then to access the time series once more.
You exit from the time series by clicking the cross before the selected questionnaire files.